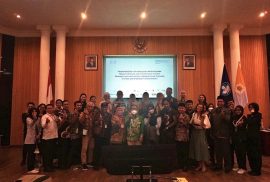
Yogyakarta, January 5th 2023─Responding to the issue of global warming caused by carbon emissions, the government is innovating to increase the use of biofuels in society. The process of extracting resources, processing, and utilizing biofuel certainly involves many parties, including political actors. This is the background for the workshop which was held as part of the “Fisipol UGM X University of Tennessee Lecture Series” on Wednesday (4/1).
The workshop with the theme “Politics of Biofuels” discussed political issues in the use of biofuels as a result analysis of Dr. Paul K. Gellert from the University of Tennessee, United States. “The biofuel policy aims to reduce carbon emissions by 2030, but we cannot deny that biofuel production also causes deforestation. That is why the government has made production rights allocations for several parties,” said Paul. He also explained that the costly production of biofuels certainly takes a large portion of state subsidies. Unfortunately, this subsidy is what the majority of corporations want, so they are competing for the allocation of biofuel production rights.


